Pattern
Generic reference ready
Enter one or both gauge readings to compare them with the reference envelope.
- Use the correct test state and refrigerant.
- Measure ambient at the equipment or vehicle.
Car A/C + home HVAC pressure checker
Choose system, refrigerant, and ambient. Enter both gauge readings for expected bands and next checks.
Pressure check
Live result
Pattern
Enter one or both gauge readings to compare them with the reference envelope.
Printable field reference
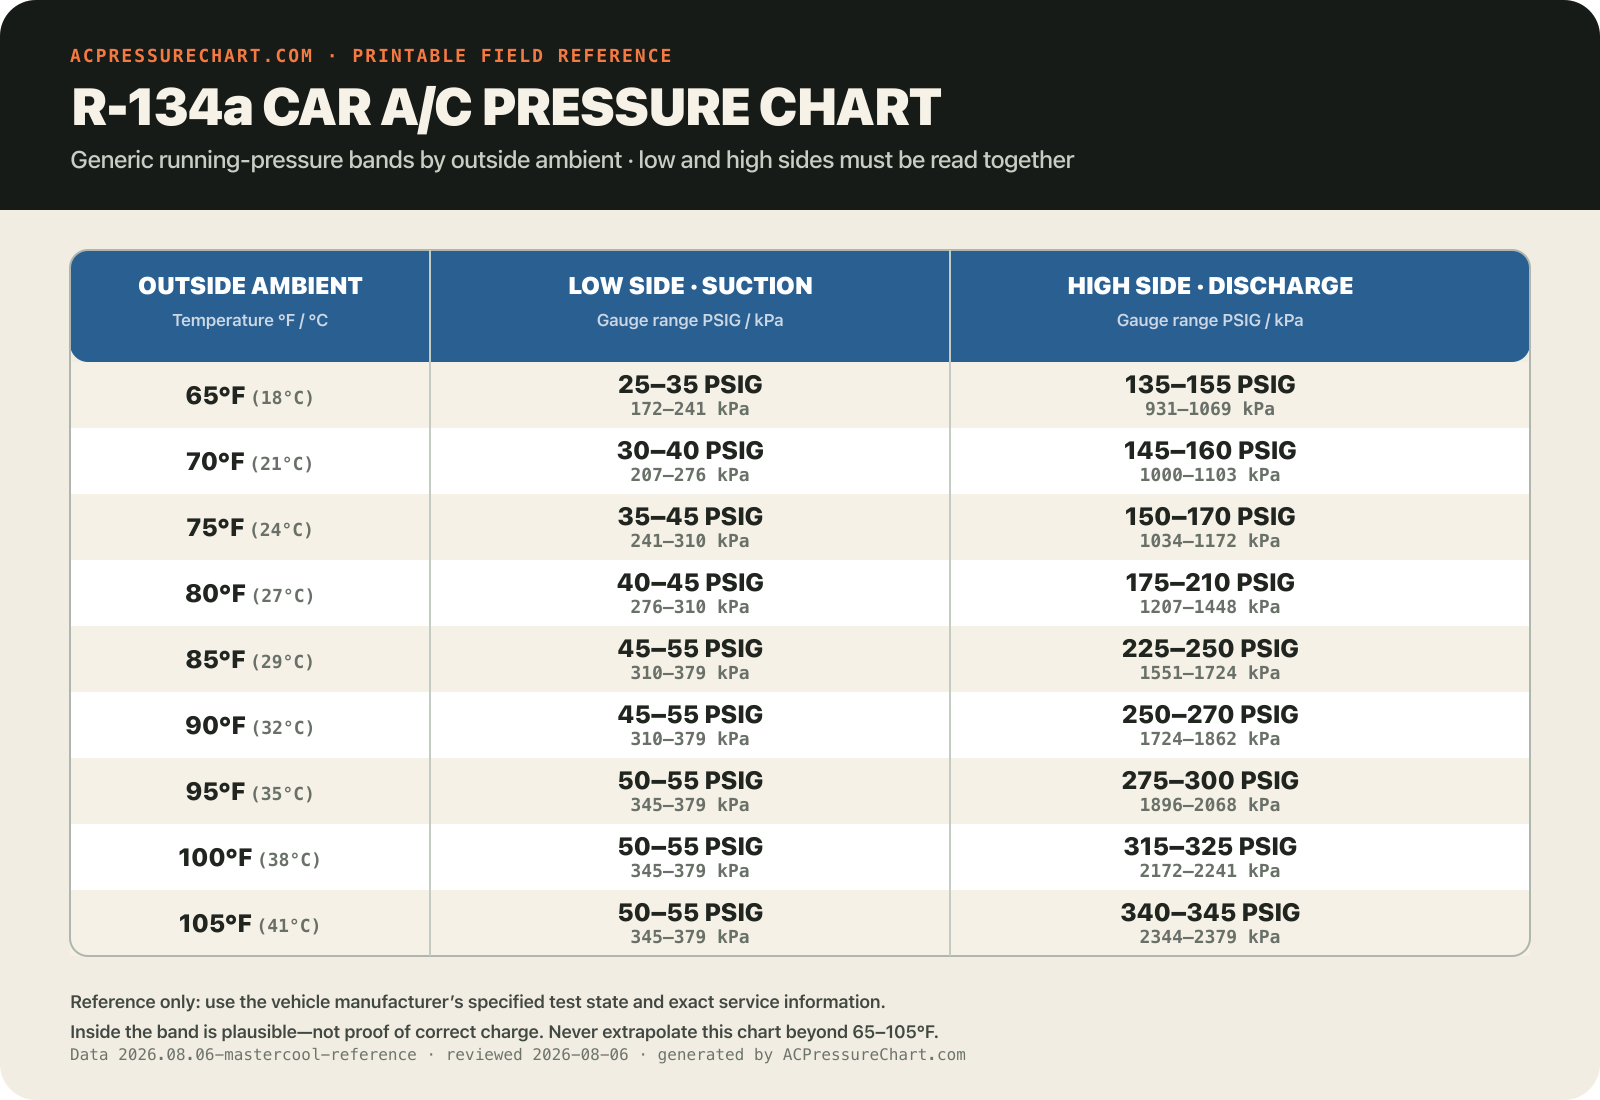
Use the reviewed automotive rows as a clean chart, print or save it as PDF, download the image, or load any temperature row back into the live checker.
Dual units are included: °F/°C and PSIG/kPa. This is a generic running-pressure reference, not a saturation P–T chart or an OEM charging target.
| Outside ambient | Low side · suction | High side · discharge | Use row |
|---|
Gauge pattern matrix
These patterns narrow the next checks; they do not identify one failed part or prove the charge. Select a row to load a representative sample into the live checker.
Pressure–temperature explorer
Convert saturation temperature to gauge pressure, or pressure back to saturation temperature. Blends expose bubble and dew instead of hiding glide.
| Temperature | Bubble | Dew | Difference |
|---|
Use the right number for the right job
A P–T chart describes phase equilibrium. A running system adds compressor ratio, load, airflow, heat exchange, metering, and control behavior.
Use suction pressure to find the dew saturation temperature, then subtract it from the measured suction-line temperature.
SH = Tsuction line − Tdew @ suction pressure
Use liquid-side pressure to find the bubble saturation temperature, then subtract the measured liquid-line temperature.
SC = Tbubble @ liquid pressure − Tliquid line
Targets depend on equipment, metering device, load, and manufacturer procedure. This site calculates the values; it does not invent a universal target.
Method, limits, and provenance
The site deliberately separates thermodynamic P–T data, generic operating references, and equipment-specific targets.
Jump to sourcesInputs convert to °F and PSIG internally so every UI, table, test, and API response uses one canonical calculation path.
Car mode interpolates only inside the reviewed 65–105°F chart. Home mode converts editable evaporating and condensing saturation bands through the selected refrigerant curves.
When elevation is entered, P–T-derived gauge values use a standard-atmosphere estimate. The separate automotive operating chart is deliberately left unchanged.
Each side is marked below, within, or above. The combined pattern suggests checks, while explicitly preserving uncertainty.
Dew is used for superheat and bubble for subcooling. Optional OEM targets are user supplied and shown only as signed deltas.
Open method
Pressure values, assumptions, and machine-readable endpoints are visible so the result can be checked instead of merely trusted.
Reviewed 5°F checkpoints from published saturation tables. R-407C and R-454B preserve bubble and dew values. Licensed CC BY 4.0.
Open source siteGeneric 65–105°F running-pressure bands. The manufacturer instruction explicitly directs users to vehicle data for exact information.
Open manufacturer pageLocal atmospheric pressure is estimated only within −1,000 to 15,000 ft, then used to translate P–T absolute pressure into a local gauge reading. It is not live weather or an instrument-calibration service.
Open atmosphere methodEngine 1.3.1 · PT dataset 2026.08.06-coolprop-7.2-5f. No external request is needed to calculate a result.
No key is required for deterministic GET requests. Responses include units, assumptions, source metadata, and structured validation errors.
/api/v1/check?mode=home&refrigerant=r410a&ambient=95&low=120&high=400